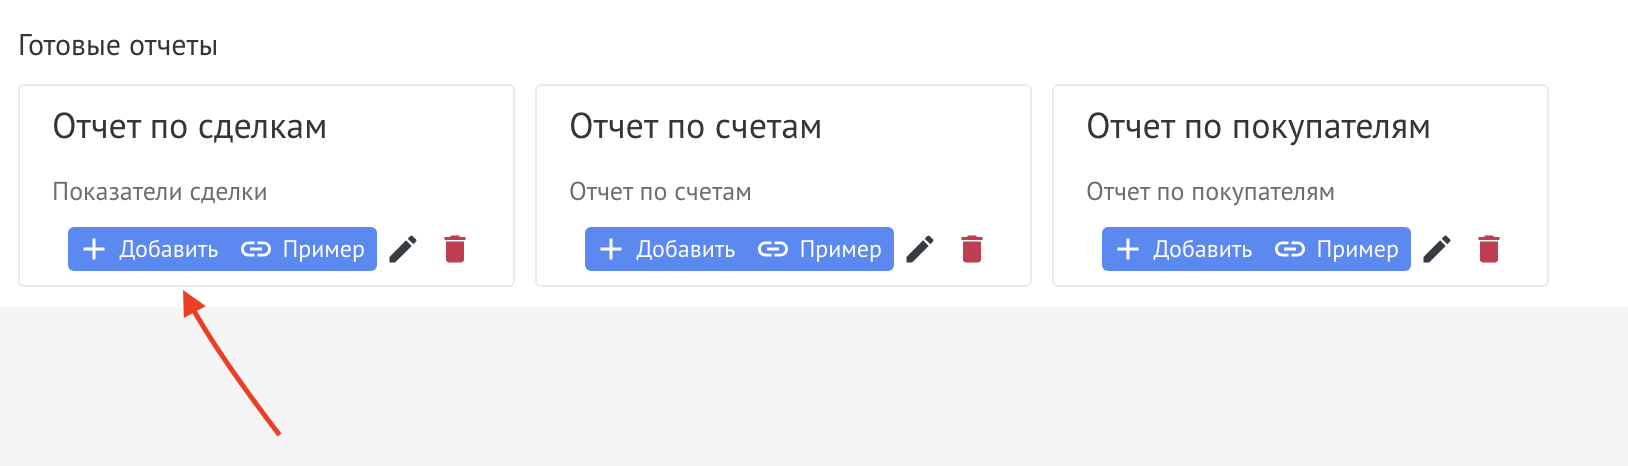
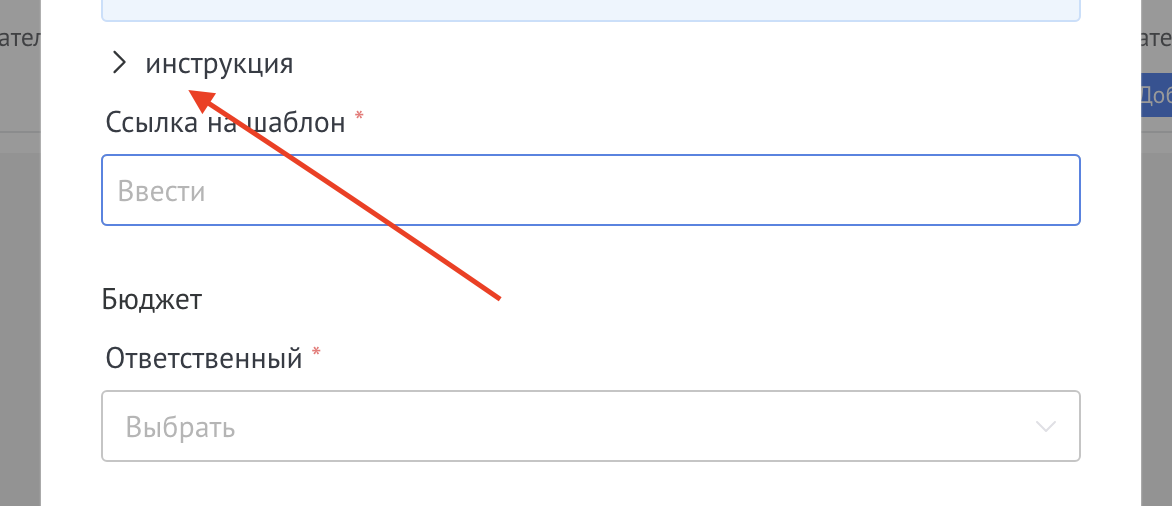
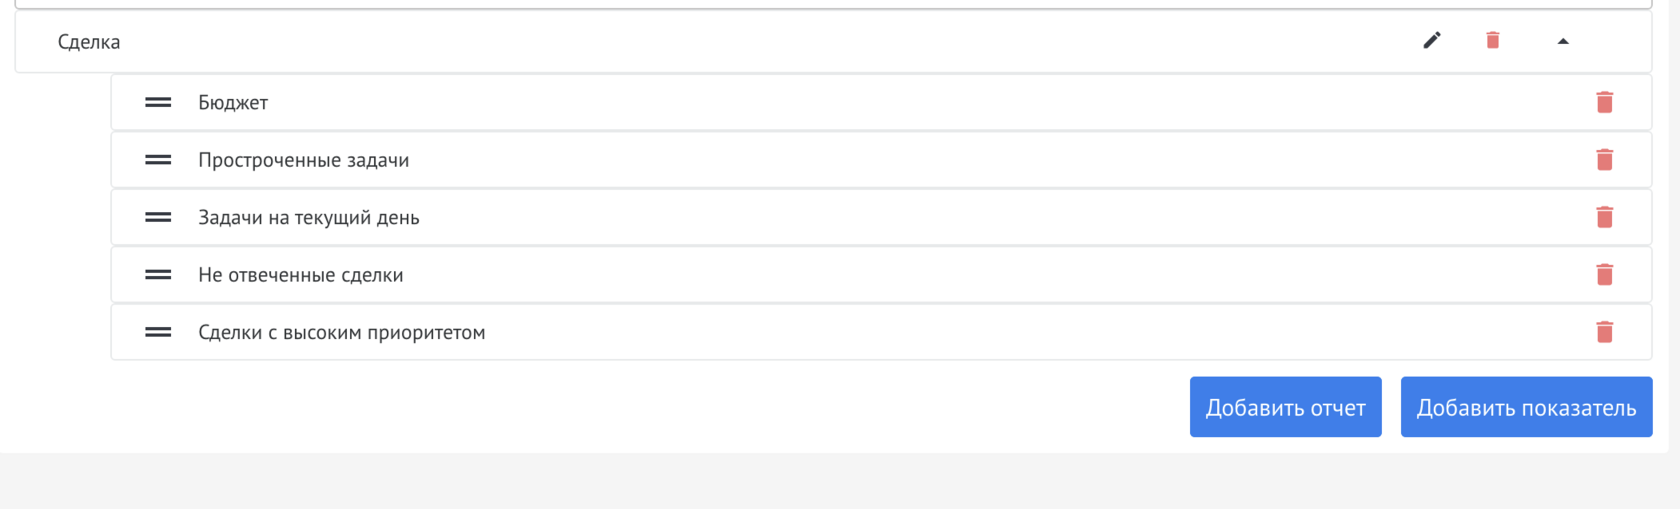
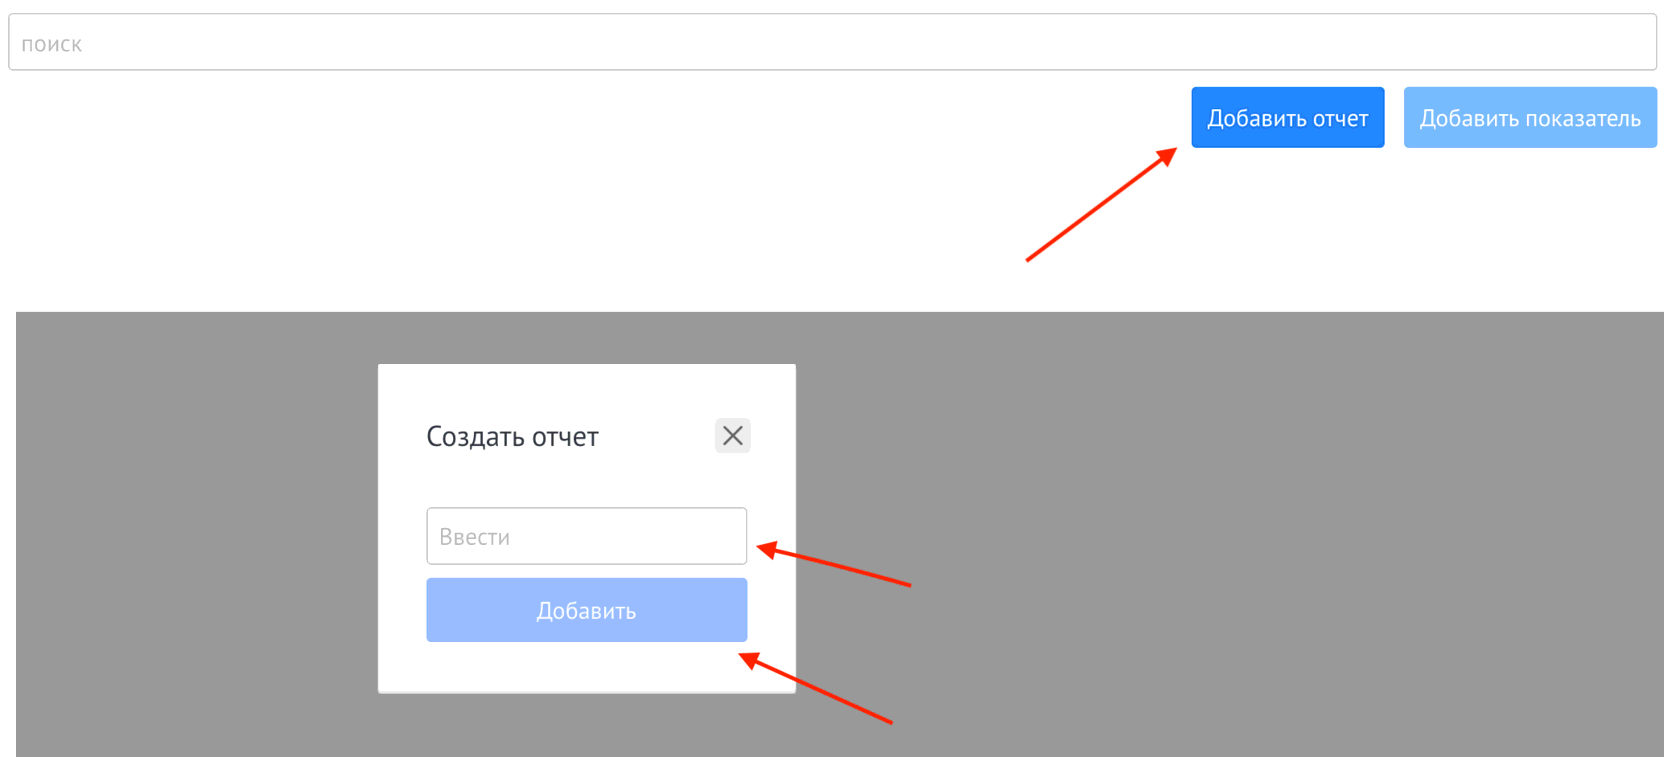
- Click Add report.
- Enter a name for the report.
- Click Add.
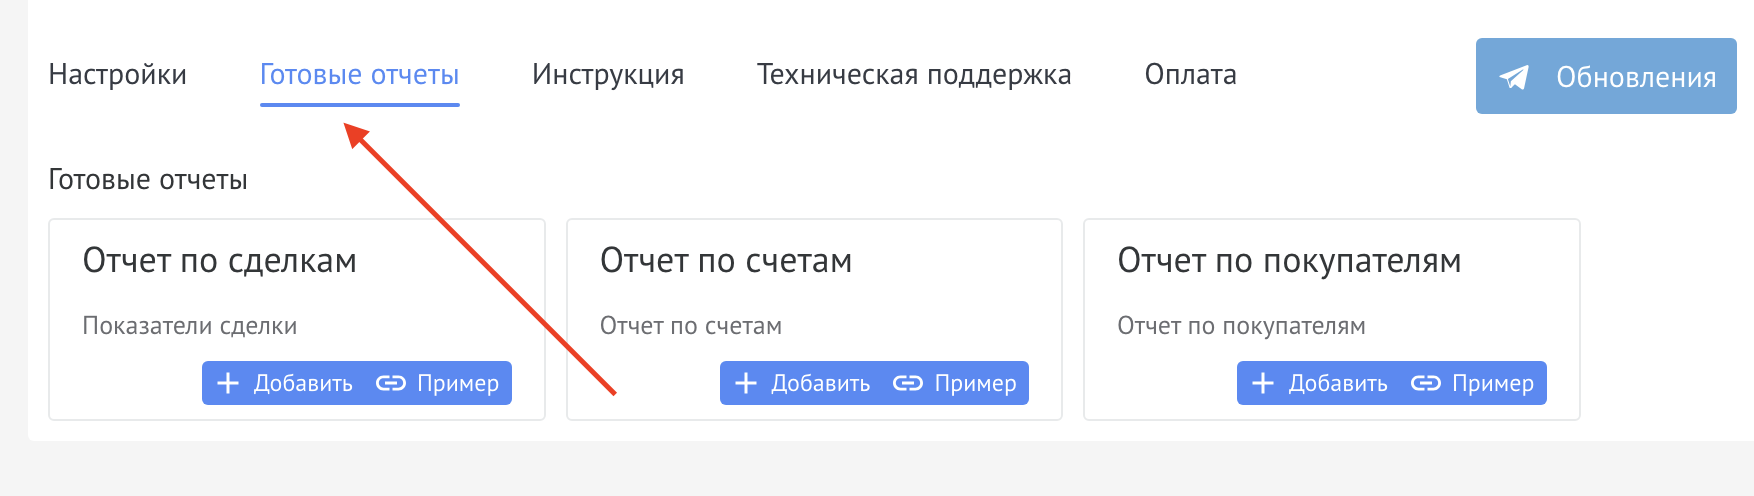
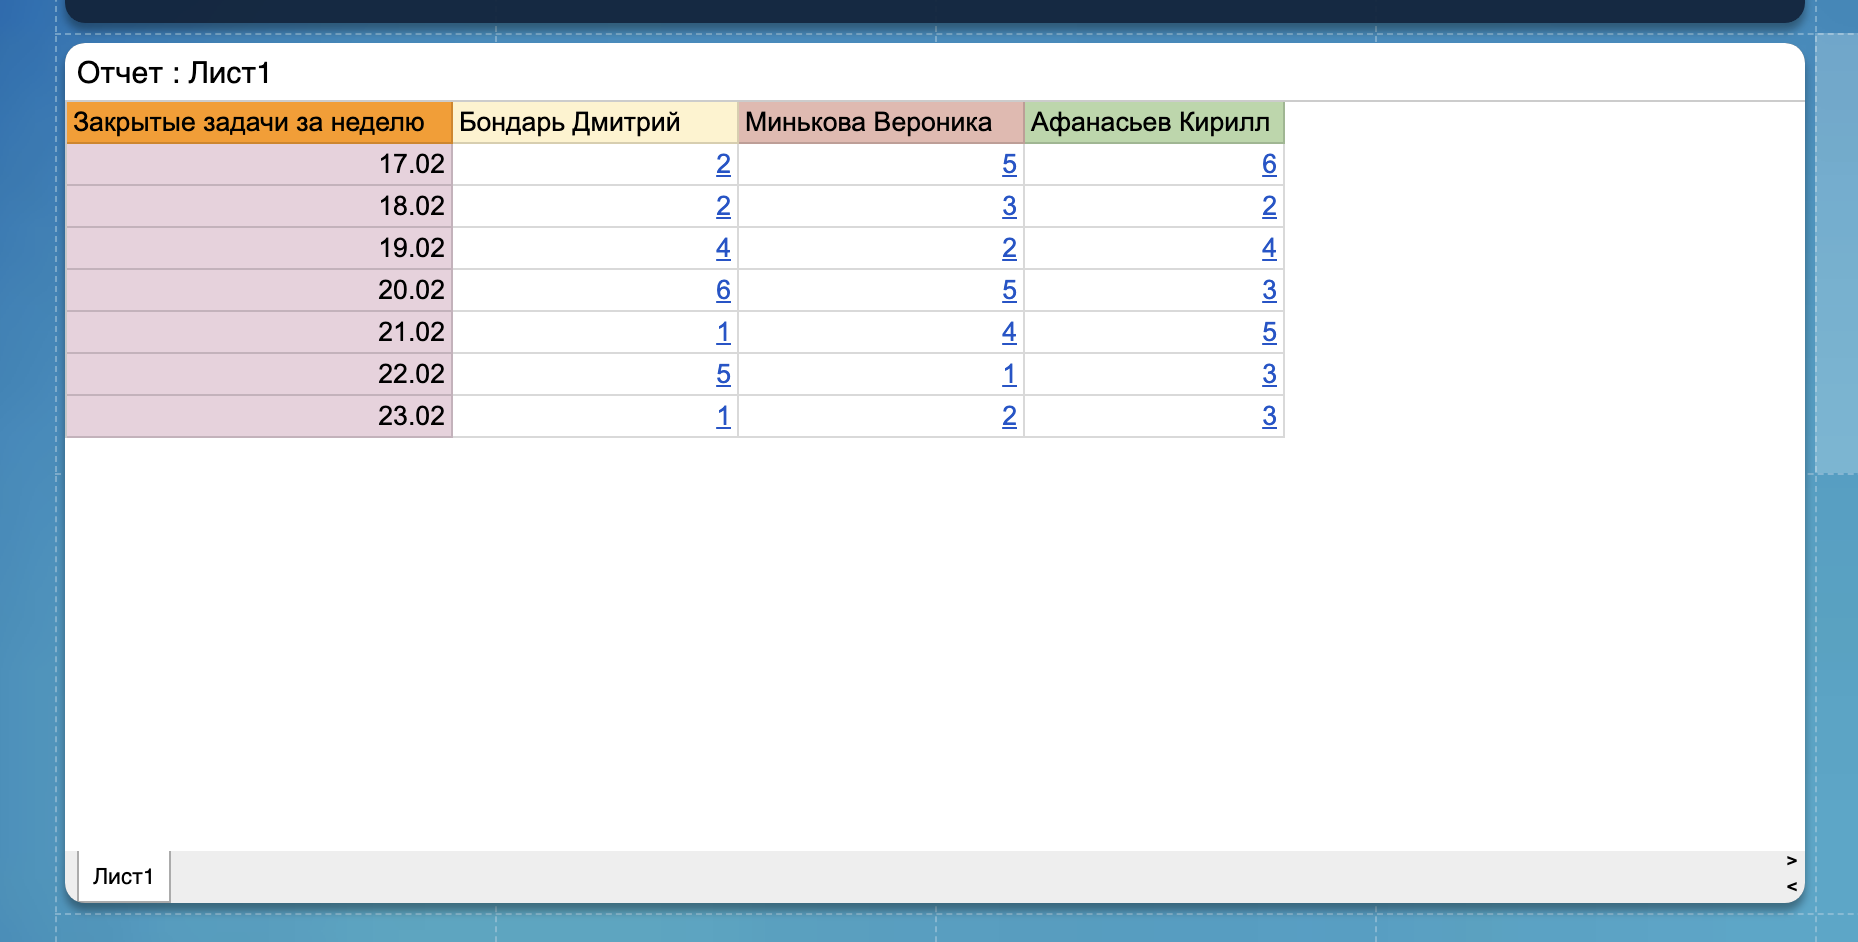
Generate visual reports on key data from Kommo: leads, tasks, contacts, companies, calls. All analytics are collected automatically.
Detailed guide for working with widget "Reports (Analytics) in Google Sheets"
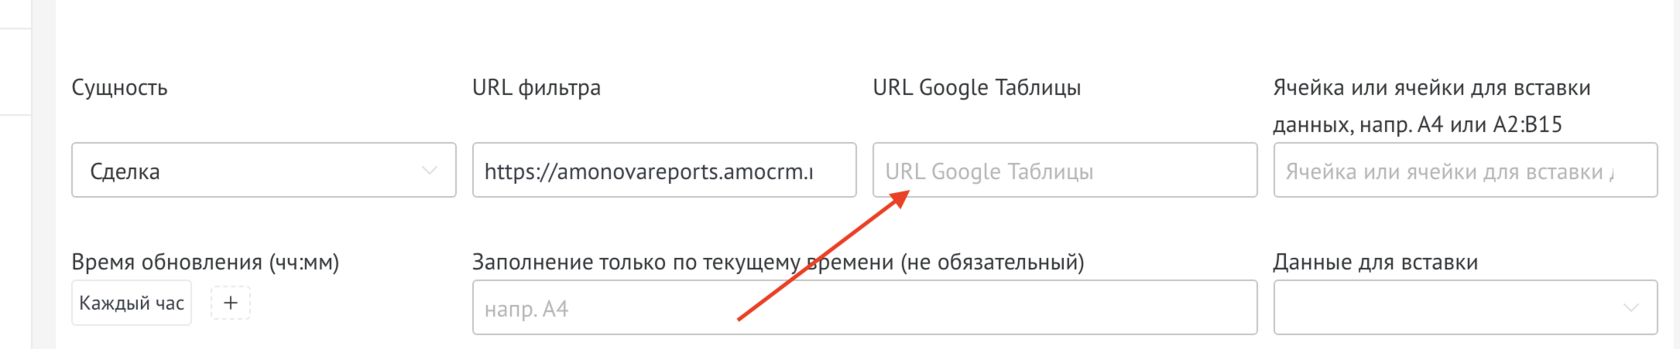
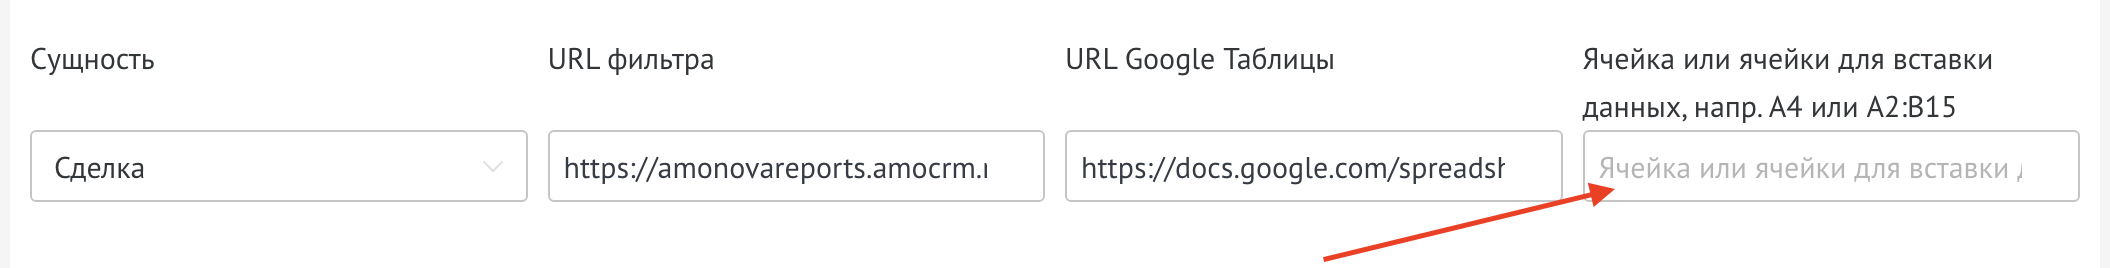
⚠ If uploading does not occur, check whether [email protected] has access to the table
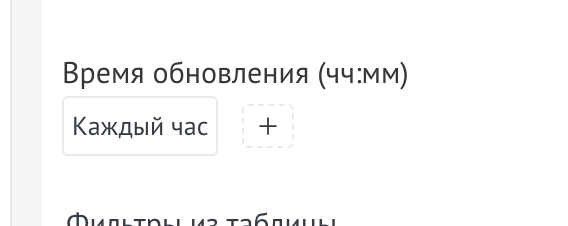
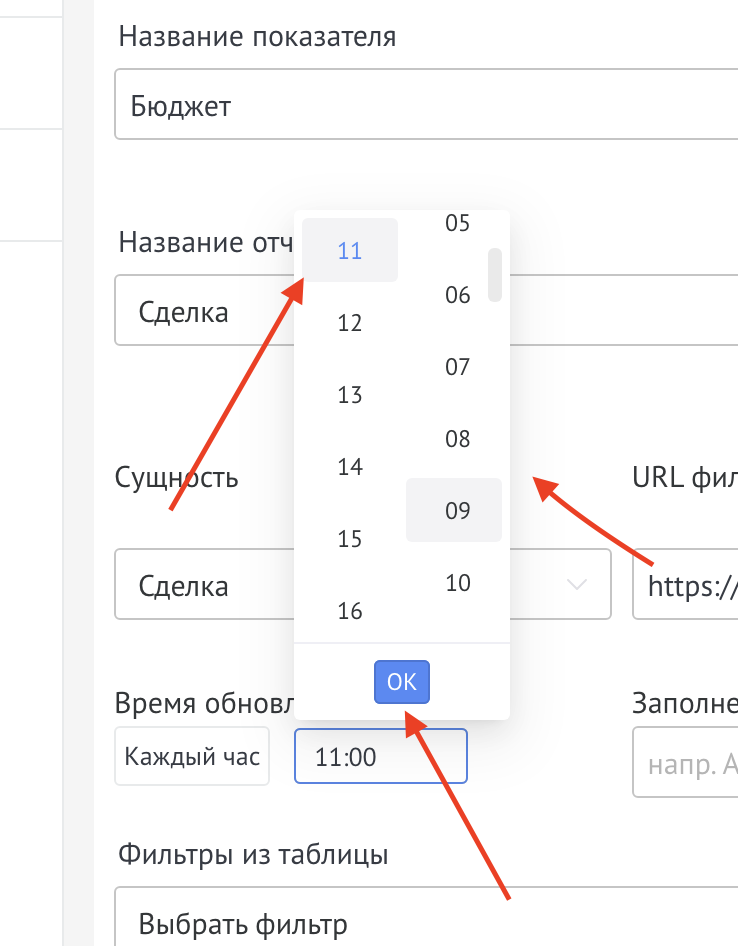
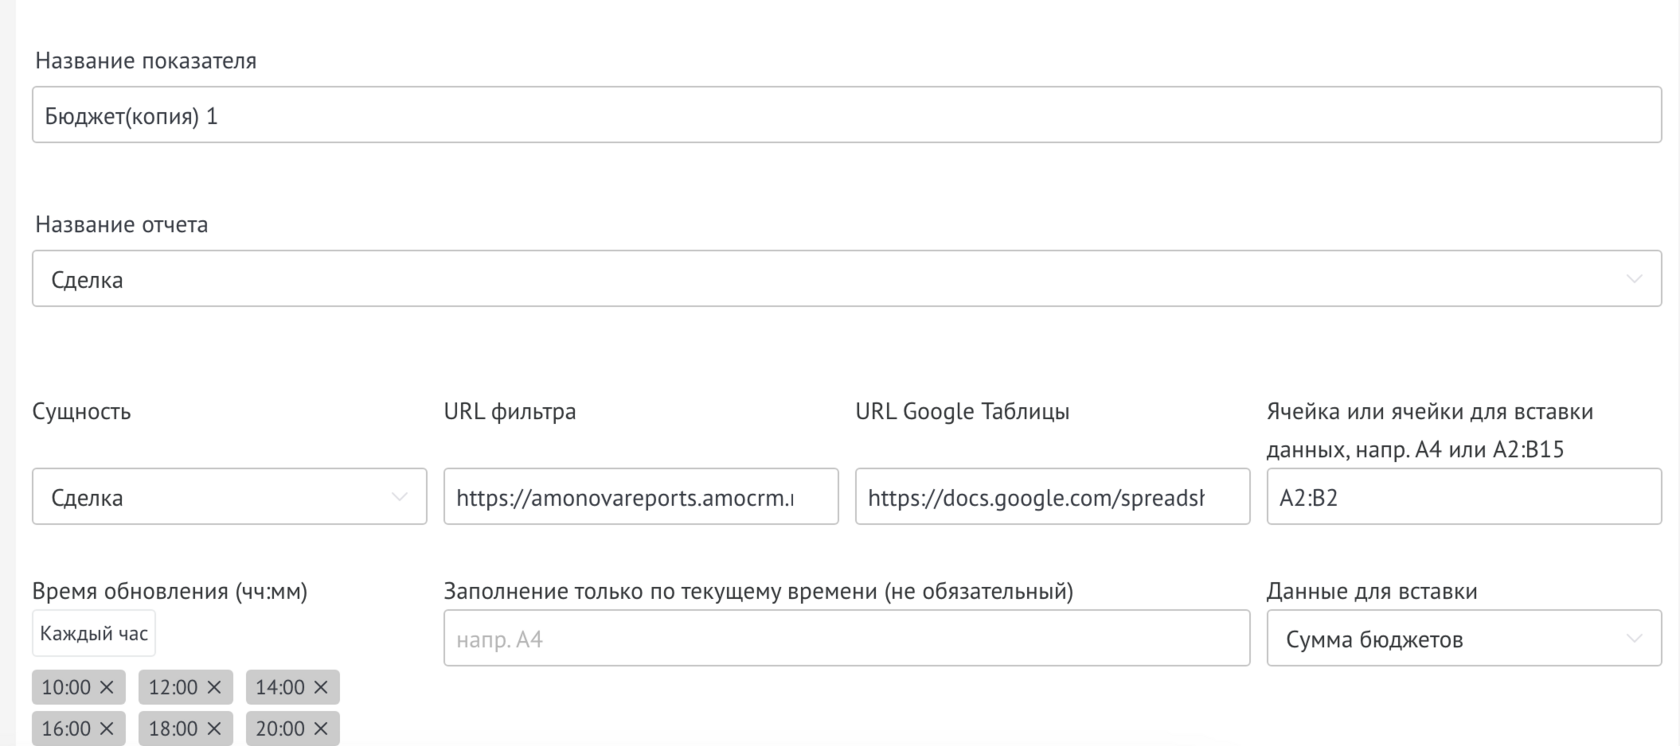
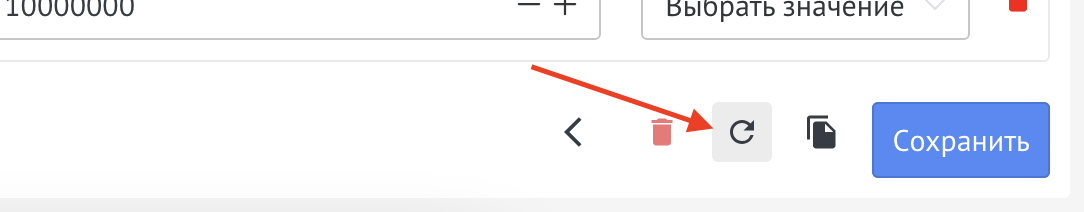
Set the update time:
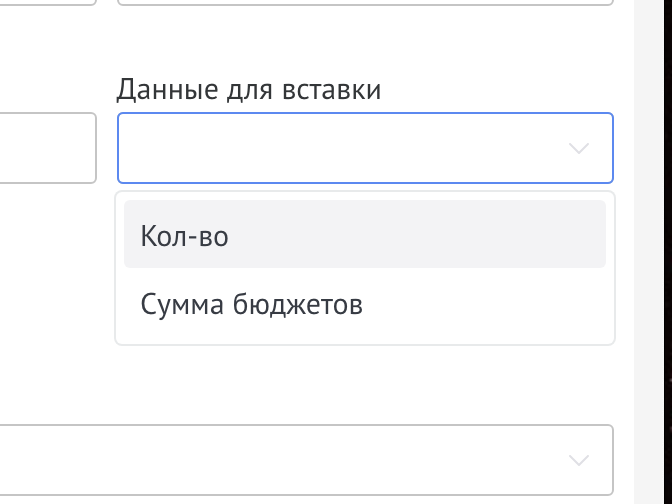
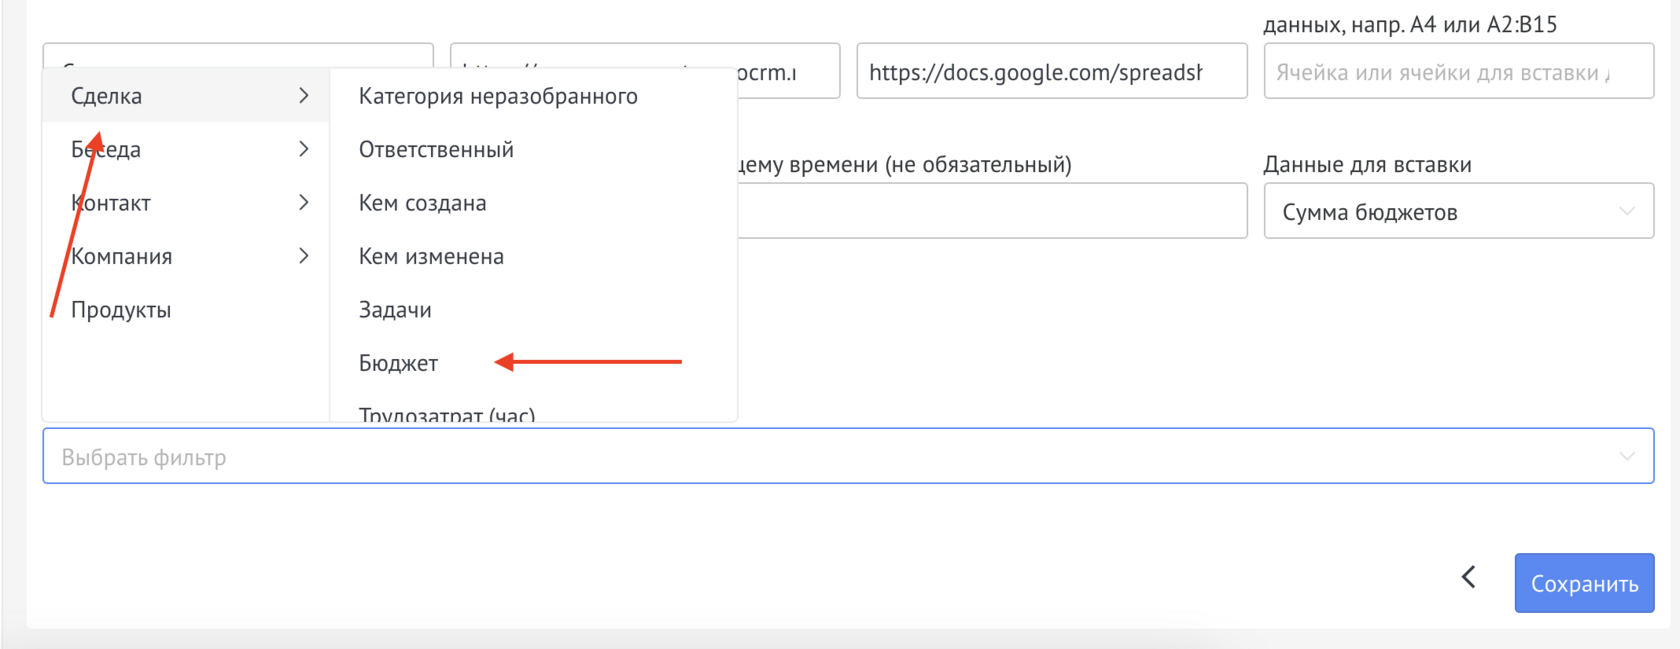
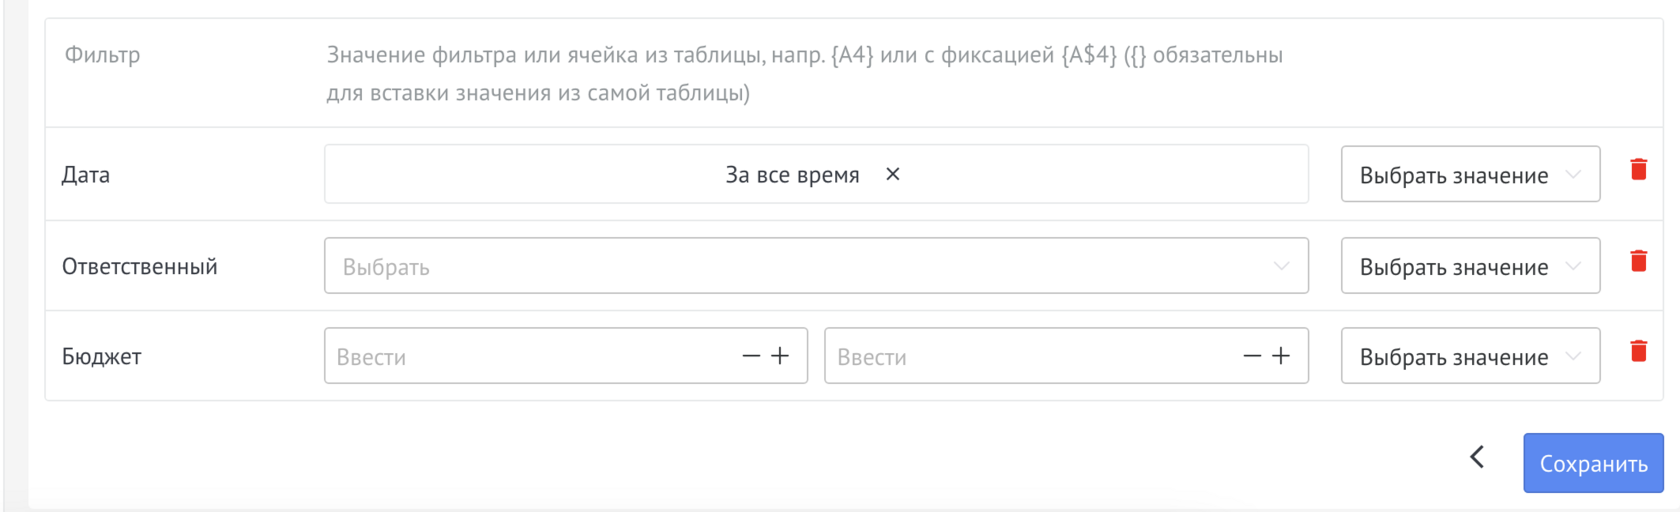
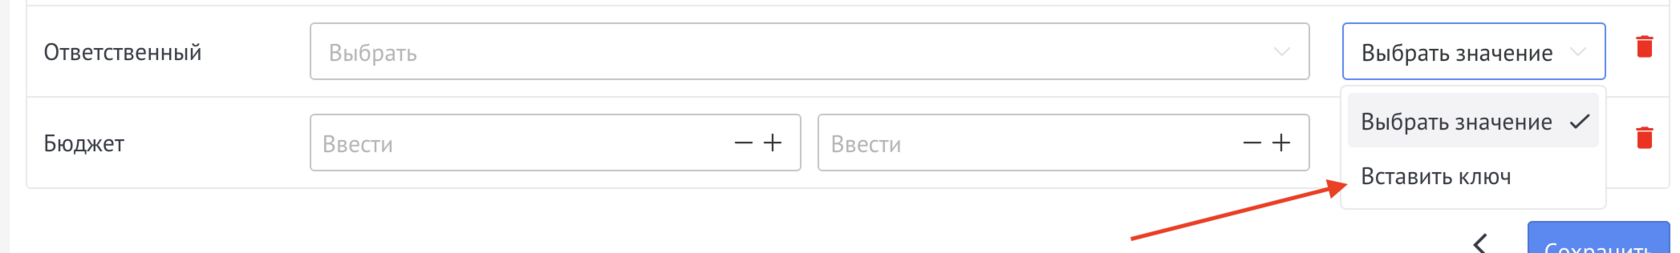
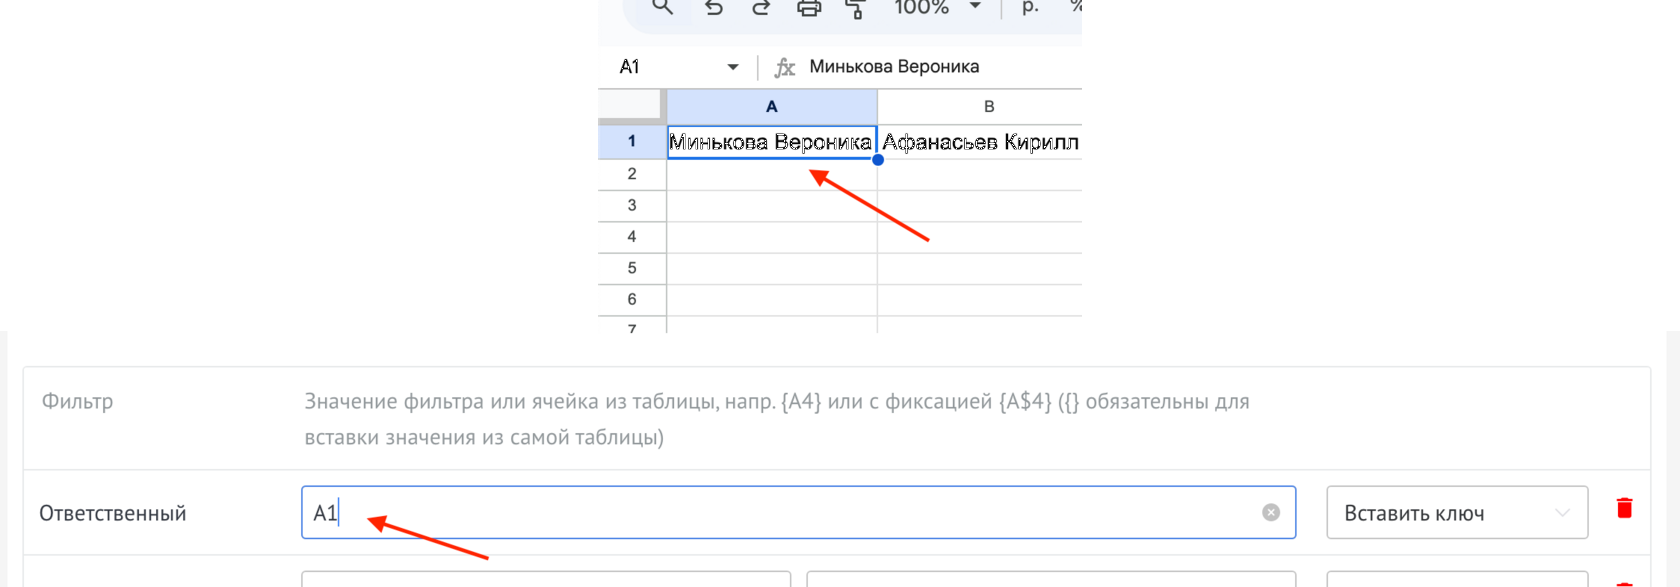
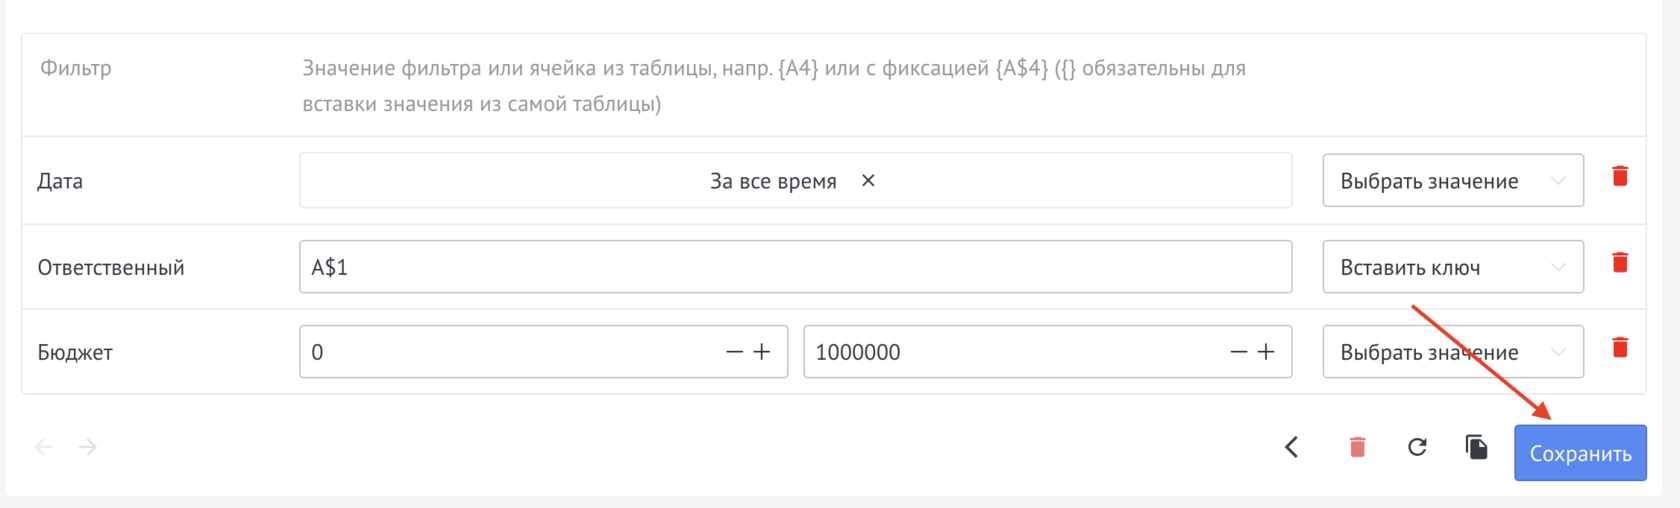
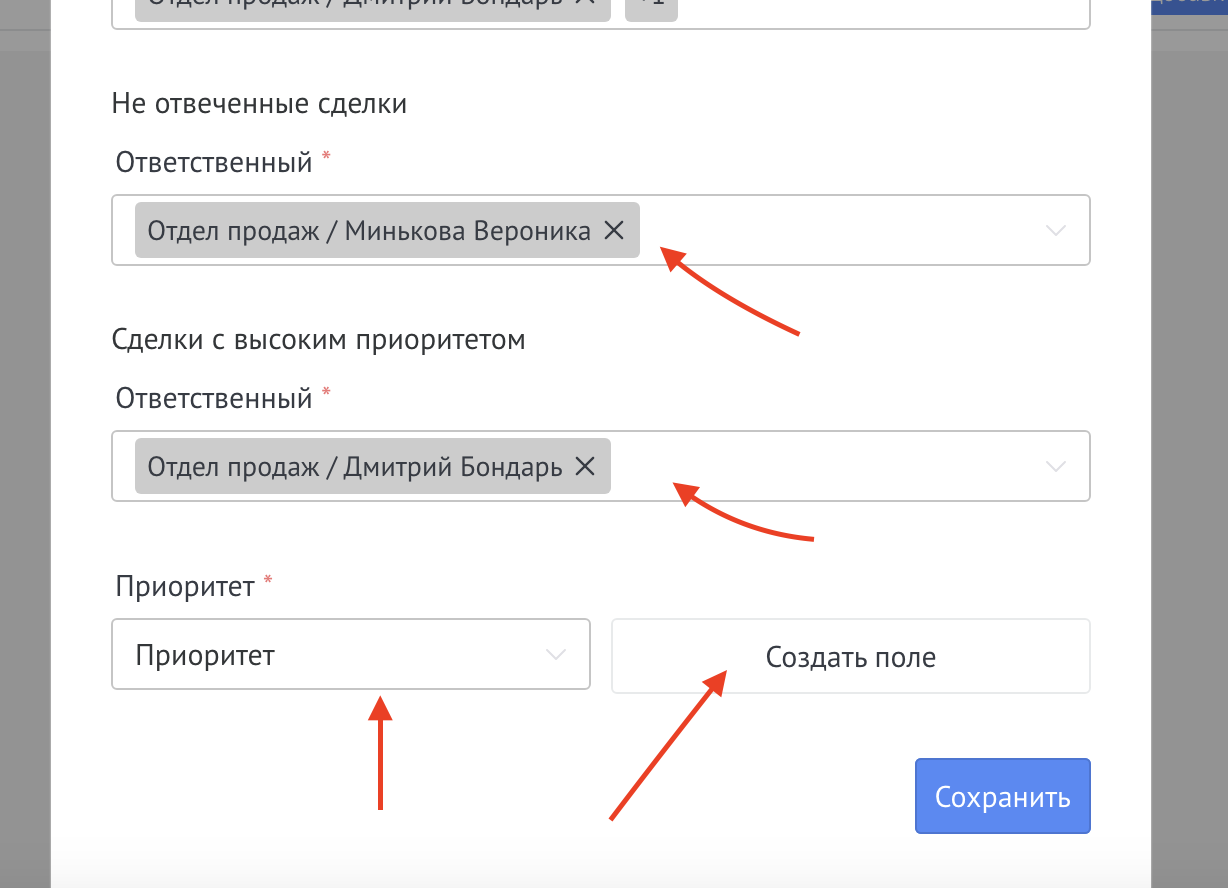
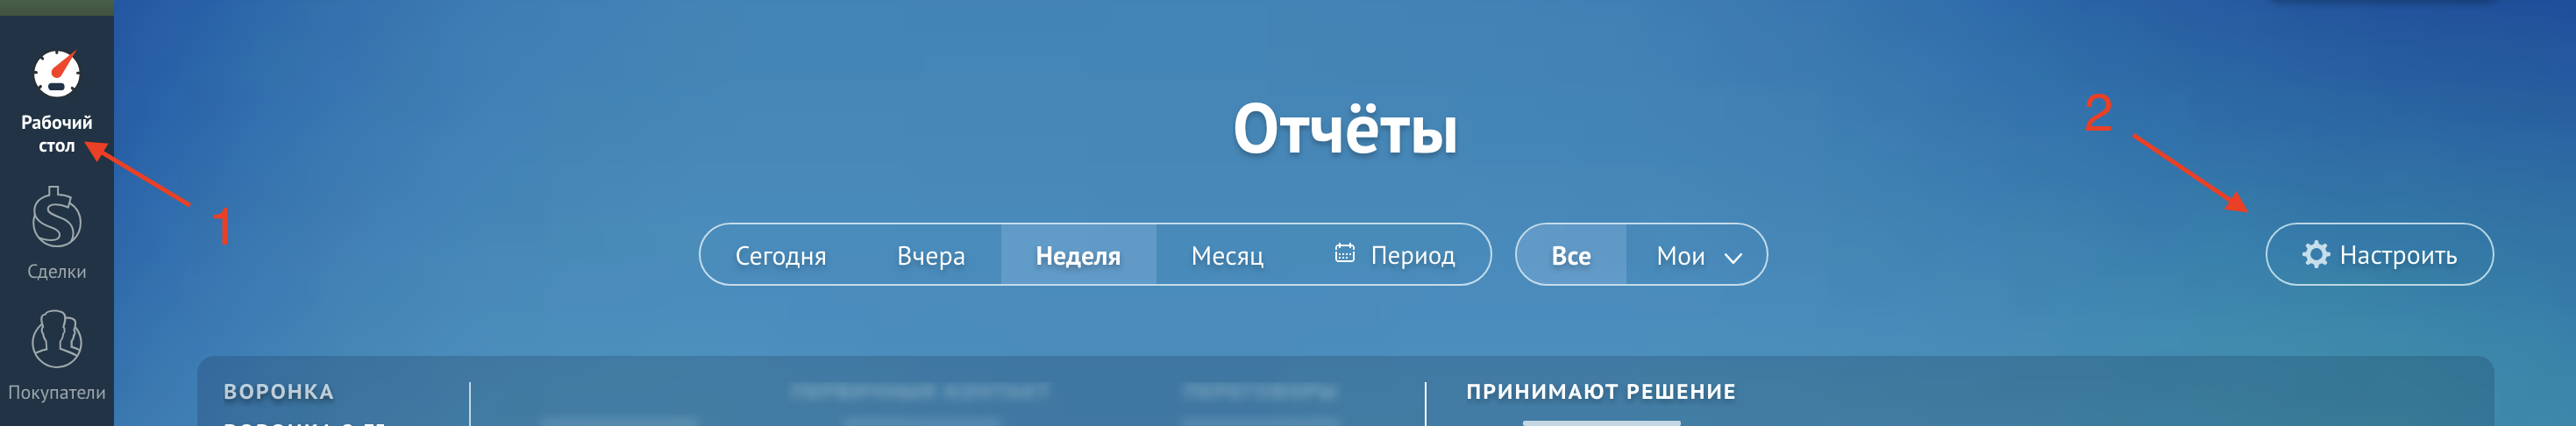
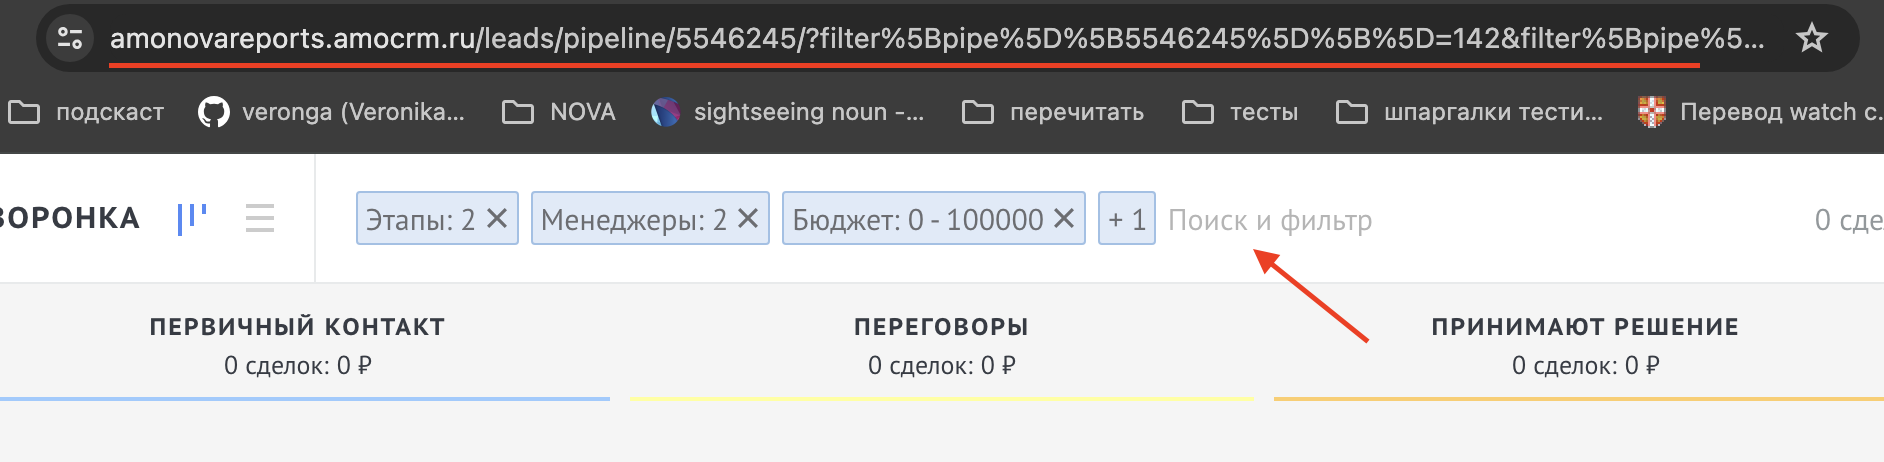
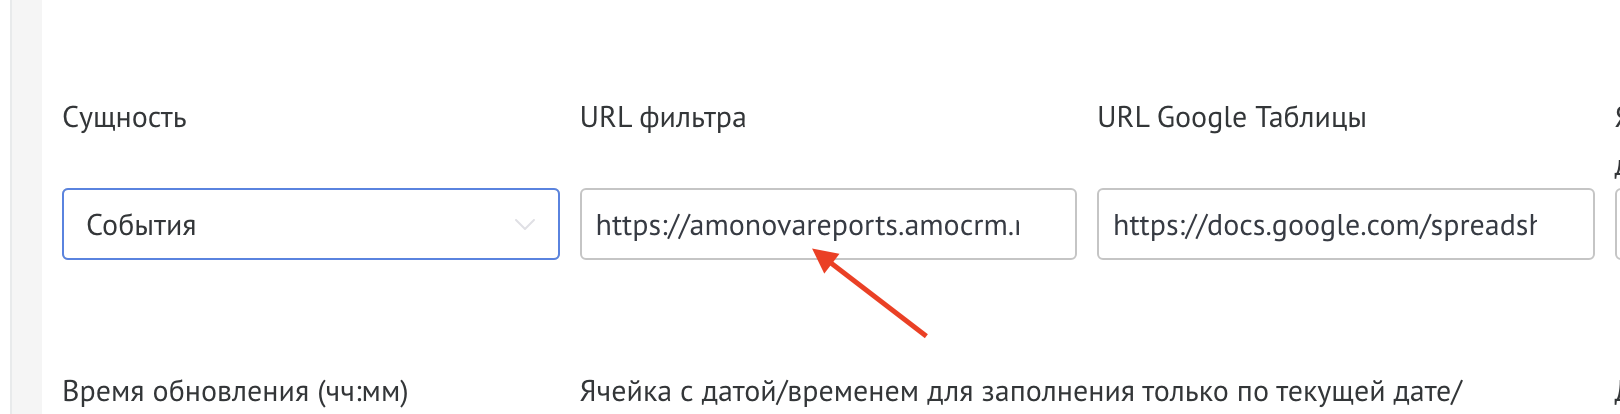
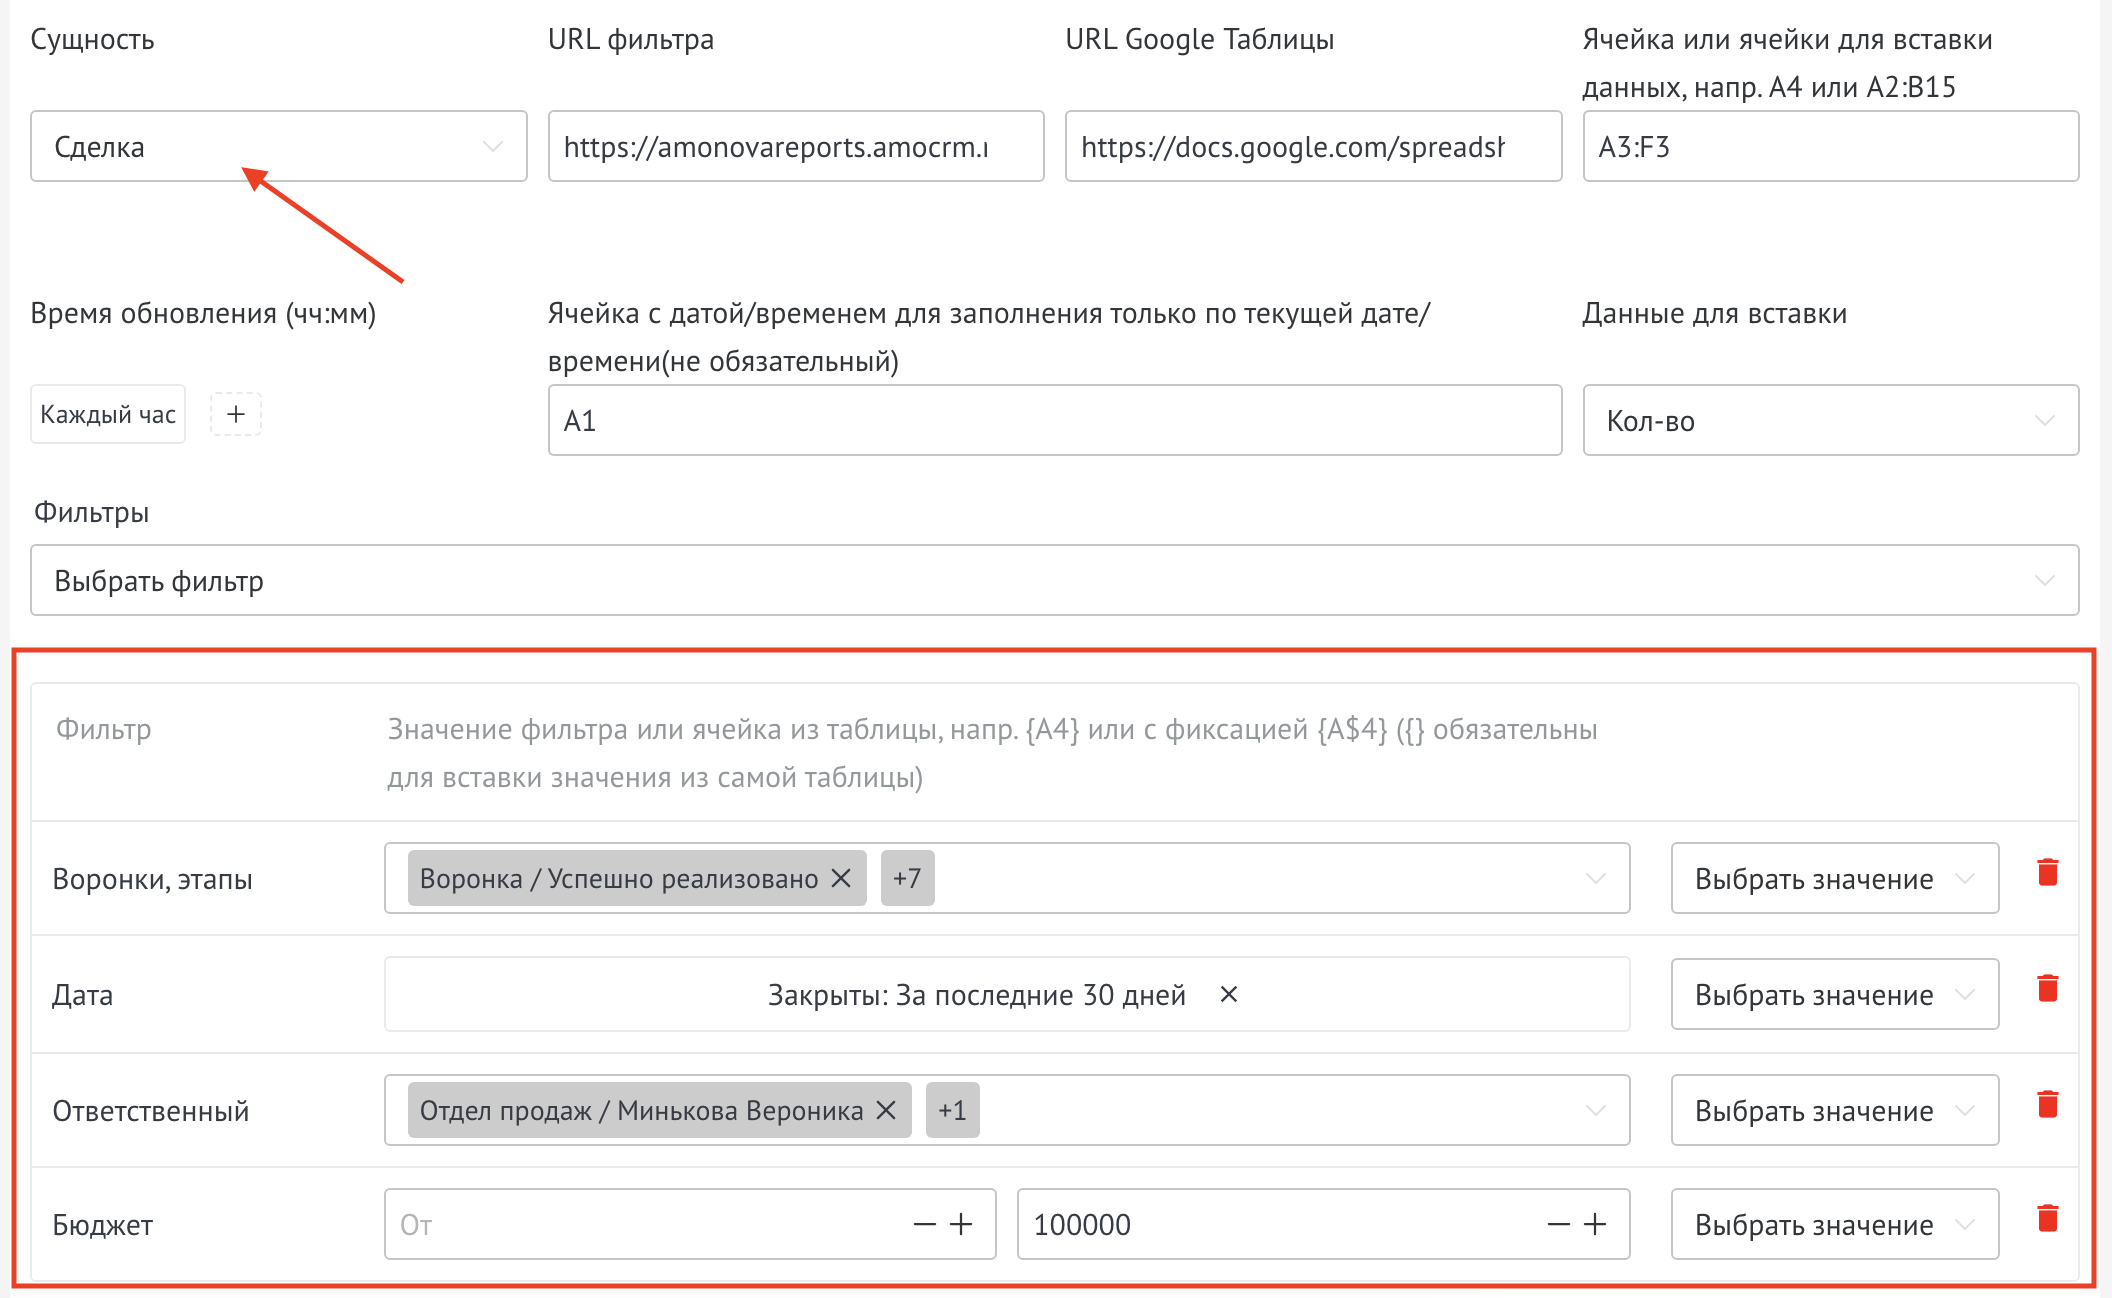
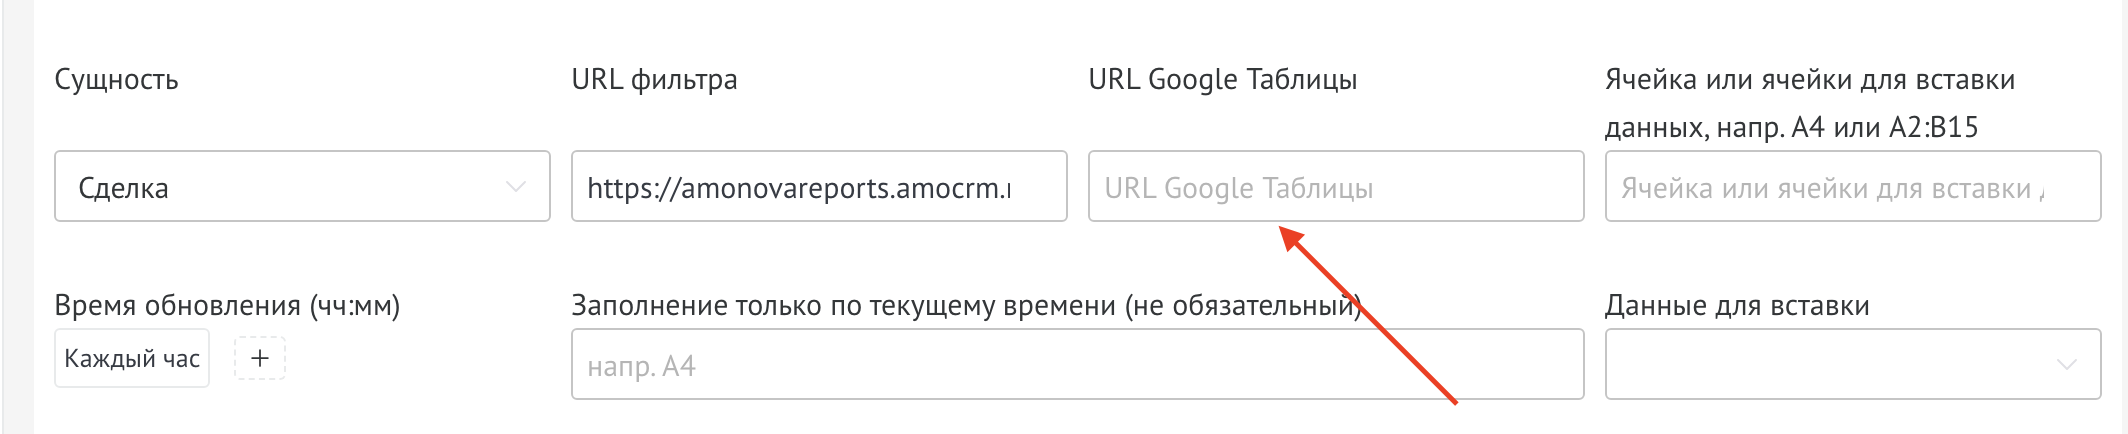
Inserting filters from Kommo:
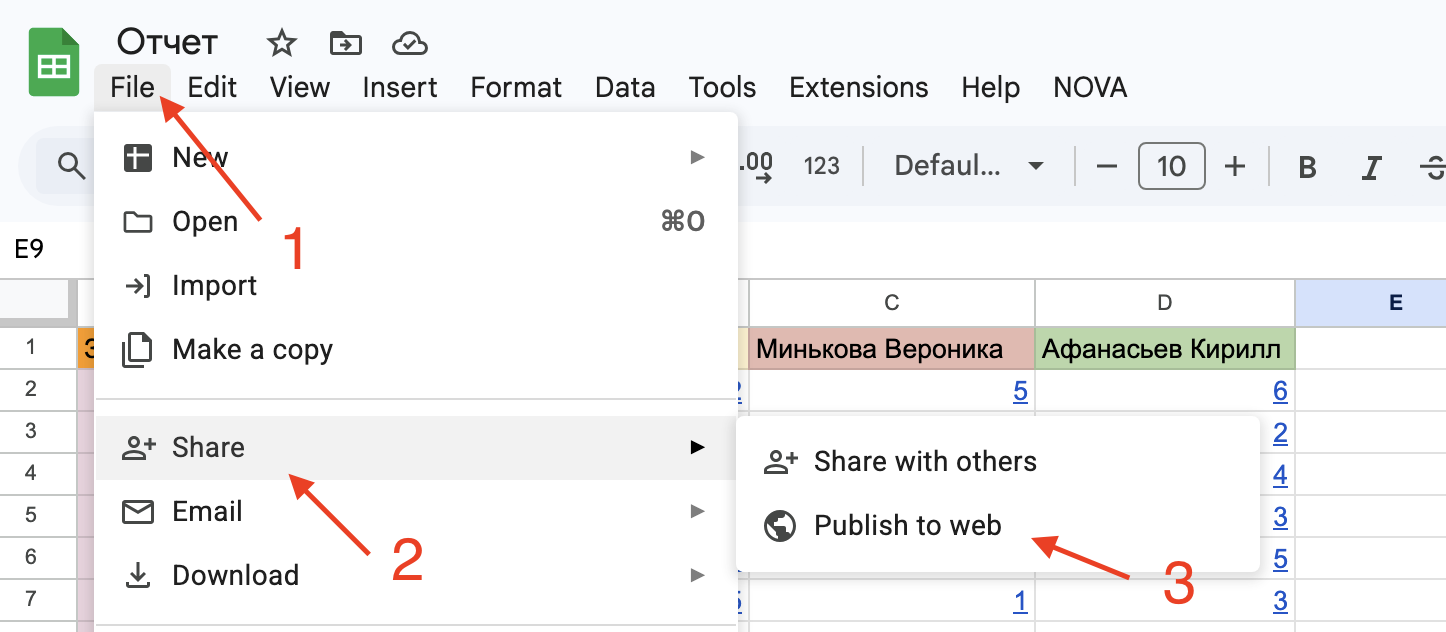
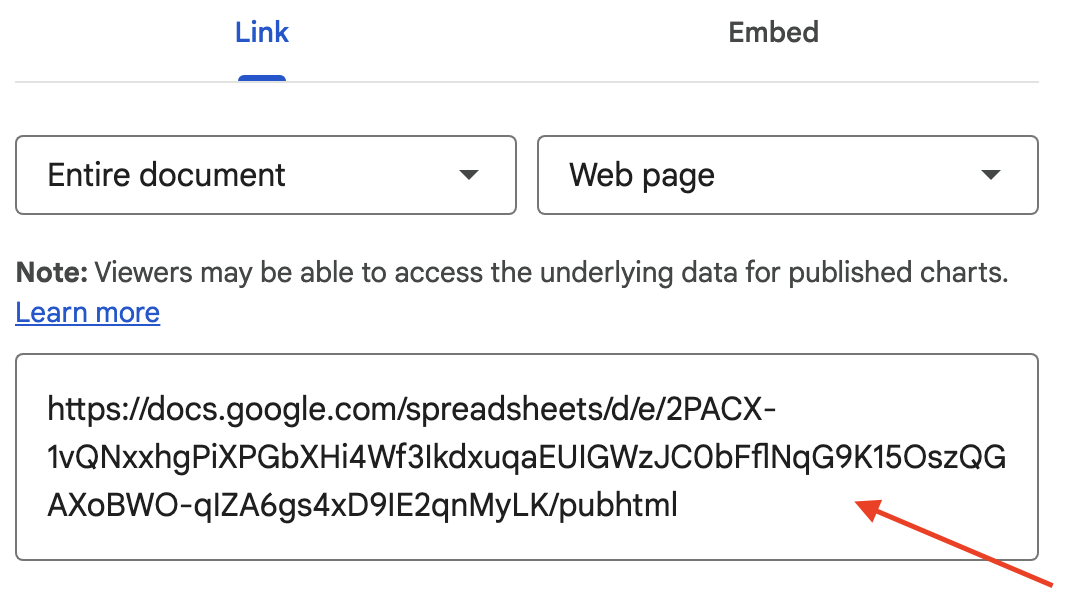
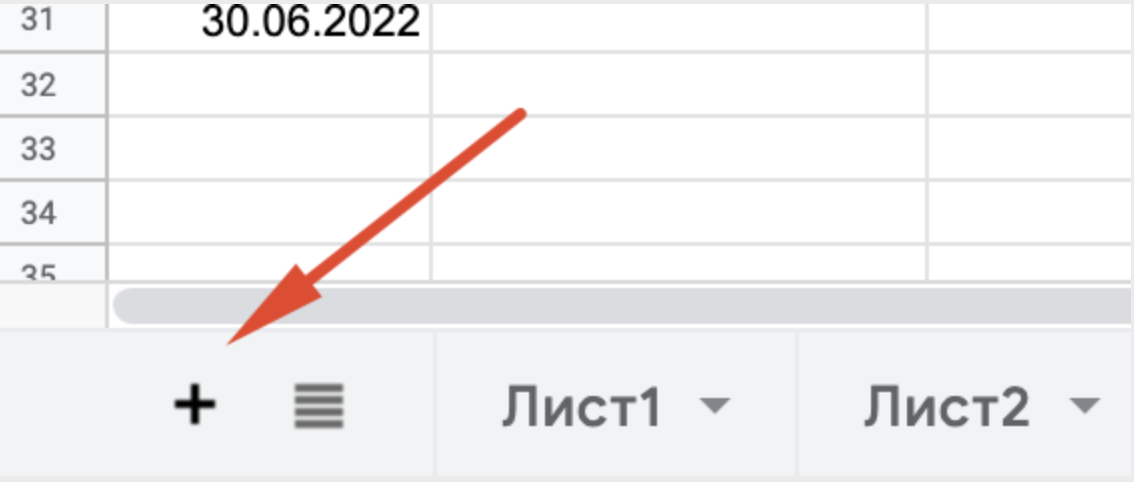
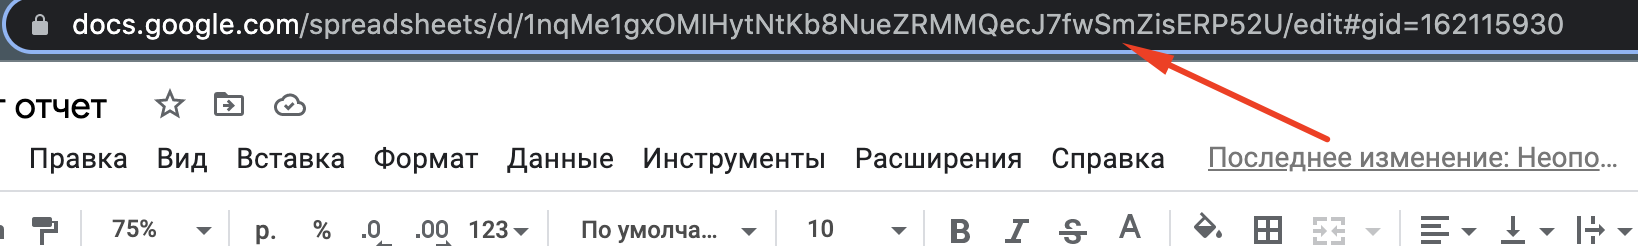
Reports can be built on different pages of Google Sheets, for this:
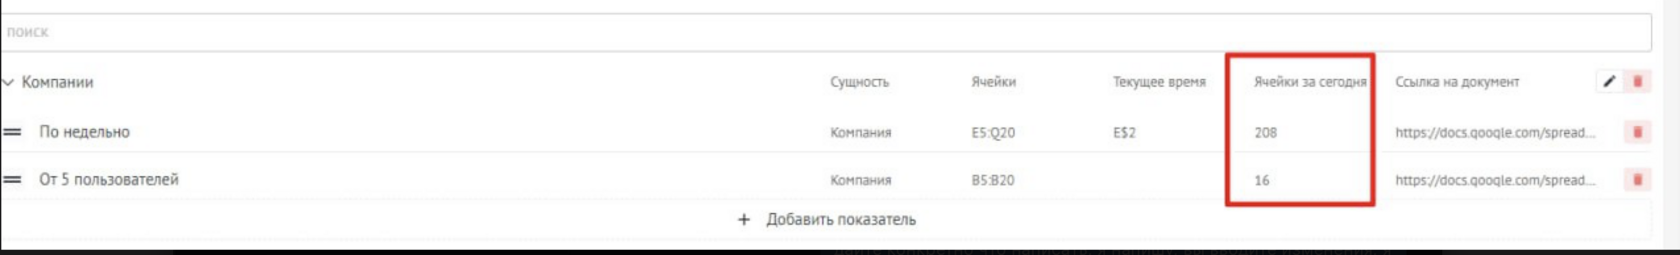
Limits:
Optimization methods:
Reduce the update frequency (for example, once a day instead of every 30 minutes).
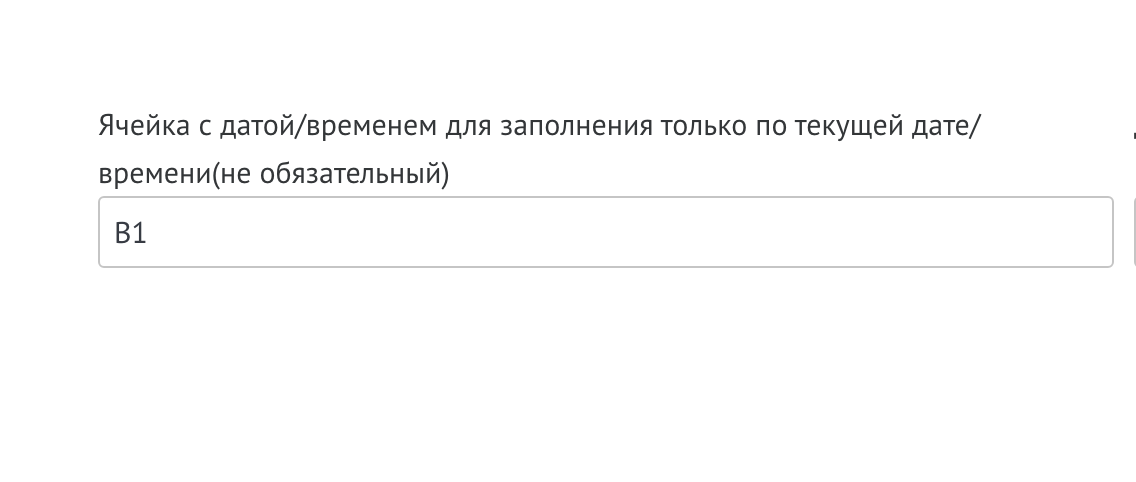
Use the fix for today option (data only for the current day).